Periodogram
• Periodogram is the correct name for the
following process*:

• FFT stands for “Fast Fourier Transform”
• The FFT algorithm that can be used to
compute the
part.
• A periodogram is formed after taking the
average magnitude squared of the FFT.
Periodogram: Simple Example
1.n = integer
2.N = array of numbers from 0 to 2^n
3.x = exp(j*2*pi*f*N) + white noise
4.pg = abs(FFT)^2 / n
5.pgs = 10*log10(pg)
•Calculates spectrum from Real/Imag
axis, starting at 0 and rotating counter-
clockwise to 2pi (one full revolution)
LIBs NEEDED
Python
matplotlib.pyplot
scipy
numpy
we can plot the periodagram using python using the following script
 ****************************************************
from pylab import *
N = arange(0,n)
x = exp(2j*pi*0.1*N)+normal(0,0.01,n)
pg = abs(fft(x))**2/n
pgs = 10*log10(pg)
plt.plot(pgs)
plt.show()
**********************************************

• Periodogram is the correct name for the
following process*:

• FFT stands for “Fast Fourier Transform”
• The FFT algorithm that can be used to
compute the
part.
• A periodogram is formed after taking the
average magnitude squared of the FFT.
Periodogram: Simple Example
1.n = integer
2.N = array of numbers from 0 to 2^n
3.x = exp(j*2*pi*f*N) + white noise
4.pg = abs(FFT)^2 / n
5.pgs = 10*log10(pg)
•Calculates spectrum from Real/Imag
axis, starting at 0 and rotating counter-
clockwise to 2pi (one full revolution)
LIBs NEEDED
Python
matplotlib.pyplot
scipy
numpy
we can plot the periodagram using python using the following script
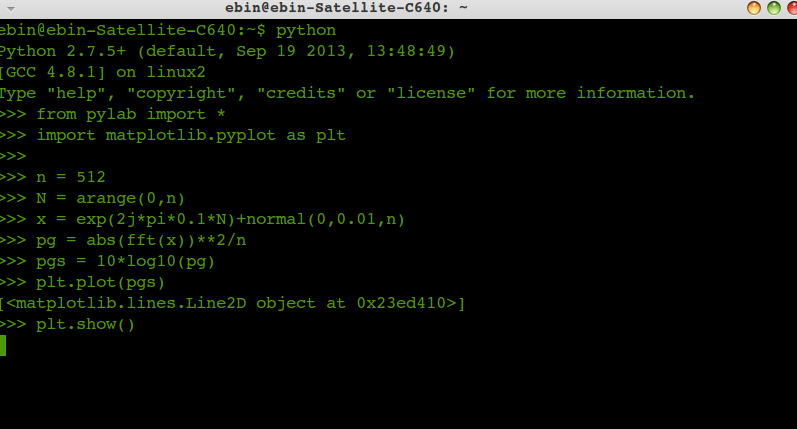
from pylab import *
import matplotlib.pyplot as plt
n = 512N = arange(0,n)
x = exp(2j*pi*0.1*N)+normal(0,0.01,n)
pg = abs(fft(x))**2/n
pgs = 10*log10(pg)
plt.plot(pgs)
plt.show()
**********************************************
No comments:
Post a Comment